Triaging a Defender XDR Incident: A Step-by-Step Walkthrough
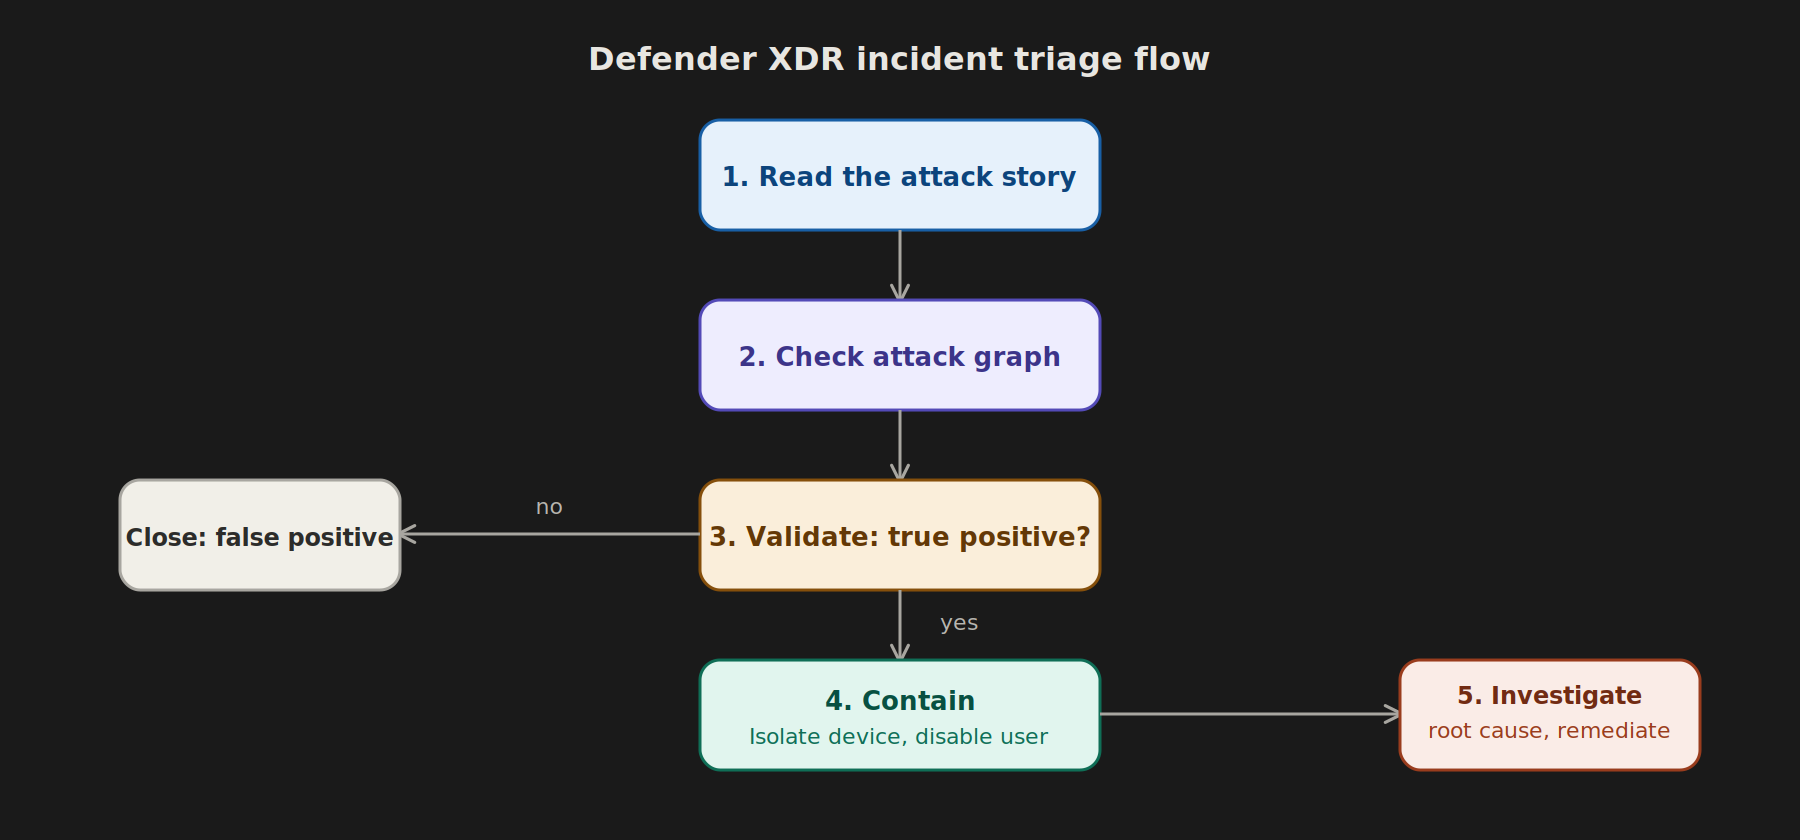
An incident lands in your Defender XDR queue. Now what? This walkthrough covers a repeatable triage process — useful whether you’re new to SOC work or standardizing a process across a team handling multiple client tenants.
Step 1: Understand the Incident, Not Just the Alert
Defender XDR groups related alerts into a single incident using correlation across identity, endpoint, email, and cloud app signals. Before touching anything, open the incident and read:
- Incident name and severity — Microsoft’s auto-generated summary of the attack story
- Alert list — how many alerts, from which products (Defender for Endpoint, Identity, Office 365, Cloud Apps)
- Impacted assets — devices, users, mailboxes involved
Resist the urge to jump straight to remediation. Understanding scope first prevents you from missing a second compromised device while you’re busy cleaning the first.
Step 2: Check the Attack Story / Graph
The incident graph visually maps how alerts relate — e.g., a phishing email → a macro execution → a suspicious PowerShell process → a network connection to a known-bad IP. This tells you the attack stage (per MITRE ATT&CK) and what’s already happened versus what might still be in progress.
Step 3: Validate — Is This a True Positive?
For each alert, check:
- Process/command line details — does this look like normal admin activity or genuinely suspicious behavior?
- User context — is this a service account behaving normally, or a standard user doing something unusual for their role?
- Timing — does it align with a known change window (patch deployment, software rollout) that could explain benign-looking anomalies?
Use Advanced Hunting to pull broader context around the same device/user/timeframe if the incident view alone doesn’t answer this — see the companion article on Advanced Hunting for query patterns.
Step 4: Determine Scope
Ask: is this isolated to one device/user, or part of something broader?
DeviceProcessEvents
| where InitiatingProcessAccountName == "<affected-user>"
| where Timestamp between (datetime(<incident-start>) .. now())
| project Timestamp, DeviceName, FileName, ProcessCommandLine
| order by Timestamp asc
Also check IdentityLogonEvents and DeviceLogonEvents for the same account across other devices — lateral movement often isn’t visible from a single alert.
Step 5: Contain
Once confirmed malicious, act quickly:
- Isolate the device — from the incident’s Devices tab, “Isolate device” (full or selective network isolation).
- Disable the user account — directly from the incident if identity signals are involved; this immediately kills active sessions when combined with token revocation.
- Revoke sessions / force sign-out — via Entra ID if a compromised account was used for cloud access, not just endpoint access.
Step 6: Investigate Root Cause
- How did the attacker get in? (Phishing? Exposed RDP? Credential stuffing?)
- What did they access or exfiltrate?
- Is there evidence of persistence (scheduled tasks, new admin accounts, registry run keys)?
Step 7: Remediate
- Remove persistence mechanisms found during investigation
- Reset credentials for affected accounts (and any accounts that authenticated from the same session)
- Patch the exploited vulnerability if applicable
- Re-image the device if rootkit-level compromise is suspected
Step 8: Close and Document
Set the incident classification (True Positive / False Positive / Benign True Positive) and determination (e.g., Malware, Phishing, Compromised Account). This classification data matters — it’s what lets you later measure detection accuracy and tune noisy rules.
Write a short closure note: what happened, what was affected, what was done, and any follow-up actions (e.g., “recommend enabling MFA for this account — currently exempted”).
For Multi-Client / MSP Environments
Keep a consistent triage template across all tenants you manage. This matters for two reasons: it lets you spot patterns across clients (a phishing campaign hitting three of your bank clients in the same week is a signal worth escalating), and it gives you audit-ready documentation for compliance-sensitive clients like government and banking.
Quick Reference Triage Flow
- Read the incident story, not just the alert
- Check the attack graph
- Validate true vs. false positive
- Determine scope (device, user, tenant-wide?)
- Contain (isolate, disable, revoke)
- Investigate root cause
- Remediate
- Classify and document